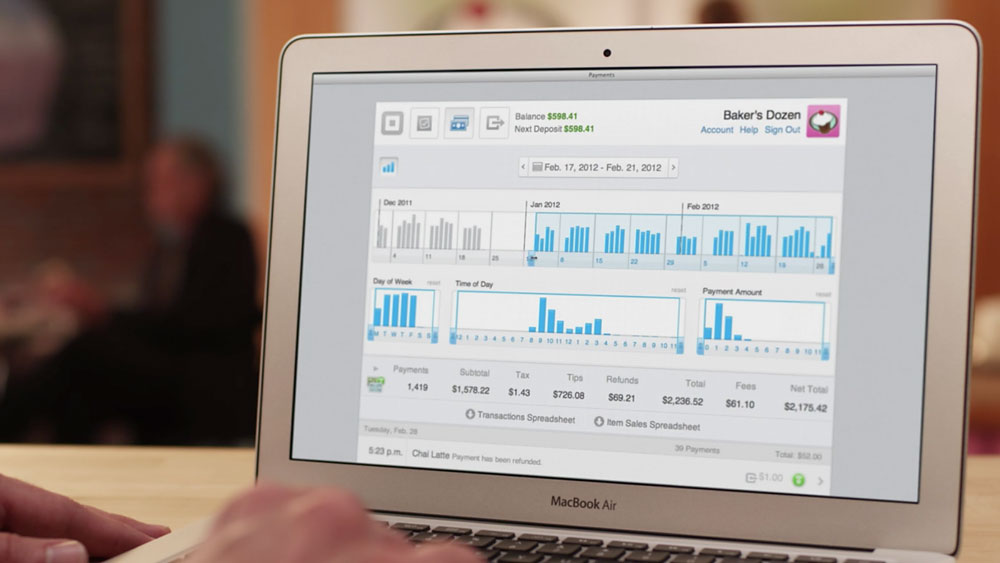
Coordinated
Visualizations
An introduction to crossfilter.js
Miles McCrocklin
@milr0c
Coordinated
Visualizations
An introduction to crossfilter.js
Miles McCrocklin
@milr0c
What is data visualization?
Coordinated Visualizations
crossfilter.js
dc.js
Resources
What is data visualization?
Data visualization is the study of the visual representation of data, meaning "information that has been abstracted in some schematic form, including attributes or variables for the units of information".
Lists
Tables
| 100 | 200 | 300 | 400 | 500 |
| 100 | 200 | 300 | 400 | 500 |
Tabs
Are all Data Visualizations
Data Visualizations (in the context of application design) are interfaces
Visual Interfaces:
collections of visual representations of an applications data model
Data Visualizations
Are Not
Just Charts.
Data Visualizations
Are
Views of data mapped to some visual space
Data Visualizations allow people to process information leveraging the way the individual can see
Coordinated Visualizations
Are
Coordinated Views (UX)
Coordinated Views:
Link components, or individual visualizations, together via some interaction
Basic Example: tabs
Past
Small Talk IDE


Snap-Together Visualization
A User Interface for Coordinating Visualizations via Relational Schemata
Chris North and Ben Shneiderman
Present

Future
imMens
Real-time Visual Querying of Big Data
Zhicheng Liu, Biye Jiang, Jeffrey Heer
How do you create Coordinated Visualizations?
"Crossfilter is a JavaScript library for exploring large multivariate datasets in the browser. Crossfilter supports extremely fast (<30ms) interaction with coordinated views, even with datasets containing a million or more records"
Crossfilter is used to manipulate data, filtering, grouping (aggregation) with very quick speeds. It is not a visualization library.
var data = [{key: "a", value: 10},
{key: "a", value: 20}, {key: "b", value: 100},
{key: "c", value: 1000}, {key: "c", value: 2000},
{key: "c", value: 3000}];

// construct a new crossfilter foo with the data
var foo = crossfilter(data);


// add records to the crossfilter
foo.records(newData);
crossfilter is slow on write and extremely fast on read
by design
Dimensions
The easiest example of a dimension is just a column within a tabular dataset
Since crossfilter is a data manipulation library it supports leveraging dimensions that are combinations of columns (date + key) or sub-values of the column (date.getYear())
I.E: crossfilter supports creation of helper columns.
// object containing all available dimensions
// (personal coding preference)
var dim = {};

// dimension that maps to the year of the row
// (subset of the time column)
dim.year = foo.dimension(function(row) {
                          return row.time.getYear();
                        });

// dimension that is of the column value
dim.value = foo.dimension(function(row) {
                            return row.value;
                          });
Dimensions: Filters
// select rows that are between the date range
dim.year.filter([2011, 2013]);

// select rows that have odd values
dim.value.filter(function(d) {
                  return d % 2;
                });

// select only rows that have exactly a value of 200
dim.value.filter(200);

// select all rows
dim.value.filter(null);
Dimensions: Top
// return an array of the top 10 values
var topTen = dim.value.top(10);


// return an array of all values seen in
// this dimension
var allTotals = dim.total.top(Infinity);
Be careful about the number of dimensions you create
"Dimensions are bound to the crossfilter once created. Creating more than 8 dimensions, and more than 16 dimensions, introduces additional overhead. More than 32 dimensions at once is not currently supported"
Groups
var groups = {};

// create a grouping by all values (years)
// in the dimension year, and count the number
// of items with that value
groups["year"] = dim["year"].group();

// create a grouping grouped by buckets of 100
groups["value"] = dim["value"].group(function(d) {
                              return Math.floor(d/100);
                            });
Groups count the values by default; but can be extended to do more
Grouping is like Map Reduce
Map Reduce is a programming model for processing large data sets with a parallel, distributed algorithm on a cluster.
var data = [{key: "a", value: 10},
{key: "a", value: 20}, {key: "b", value: 100},
{key: "c", value: 1000}, {key: "c", value: 2000},
{key: "c", value: 3000}];

var map = function(item) {
            emit(item.key, 1);
          };
var reduce = function(key, values) {
                return values.length;
              };

var results = mapReduce(data, map, reduce);
/* [{ key: "a", value: 2 },
{ key: "b", value: 1 },
{ key: "c", value: 3 } ]; */
groups["mean"] = dim["value"].group();

// group.reduce(addFunc, removeFunc, initialFun)
groups["mean"].reduce(function(p, v) {
                        ++p.count;
                        p.value += v.value;
                        return p;
                      },
                      function(p, v) {
                        --p.count;
                        p.value -= v.value;
                        return p;
                      },
                      function() {
                        return {count: 0,
                                value: 0};
                      });
var data = [{key: "a", value: 10},
{key: "a", value: 20}, {key: "b", value: 100},
{key: "c", value: 1000}, {key: "c", value: 2000},
{key: "c", value: 3000}];
groups["mean"].all().forEach(function(d) {
var v = d.v;
console.log(d.key + ": " + (v.value/v.count));
});
/*
a: 15,
b: 100,
c: 2000
*/
So now that we know how to manipulate the data, how can we get users to manipulate the data via interactions?
dc.js is a charting library that wires up it's visualizations with filtering interactions on the coorisponding dimension
A dimensional charting library.
Give it a dimension and a group and it will visualize the data and link the components together
var charts = {};


chart["year"] = dc.rowChart("#year")
                    .dimension(dim["year"])
                    .group(group["year"]);

chart["value"] = dc.barChart("#value")
                    .dimension(dim["value"])
                    .group(group["value"]);


// initialize all charts
dc.renderAll();
Yep, that easy
Resources
[ prototype:
crosssfilter videos ]
Ian Johnson @enjalot
Snap2Diverse
Coordinating Information Visualizations and Virtual Environments
Nicholas F. Polys, Chris North, Doug A. Bowman, Andrew Ray, Maxim Moldenhauer, Chetan Dandekar
Lark
Coordinating Co-located Collaboration with Information Visualization
Matthew Tobiasz, Petra Isenberg, and Sheelagh Carpendale
Building Highly-Coordinated Visualizations in Improvise
Chris Weaver
Exploring Context Switching and Cognition in Dual-View Coordinated Visualizations
Gregorio Convertino, Jian Chen, Beth Yost, Young-Sam Ryu, Chris North
Thank You!
Questions?
Bluenose is Hiring!