Demo-1: Choosing Map Scales
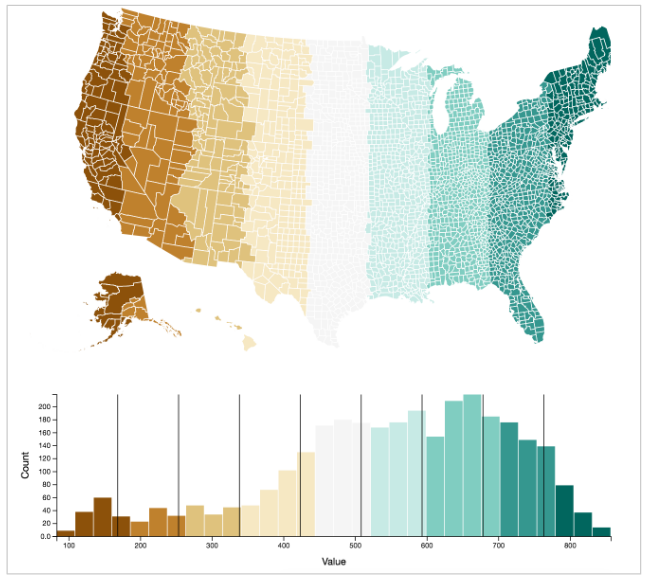
This demo is from this course taught by Mike Freeman at the University of Washington. It allows you to explore the impact of using Quantile and Quartile scales for shading a map. It also allows you to view all color pallettes from ColorBrewer. Simply fork and clone this repository, then run a local server to see it in your browser.
Note, the code does not follow suggested reusability patterns as described in Module-10. This was largely to prevent providing students with answers to a related assignment.