whitepaper
PTV xMapServer-2 supports the Google-style map tile standard. This allows to use xMapServer with virtually every exeisting mapping client for both cloud and on-premise. These clients also have APIs to overlay the map with your own data, so you can keep you data where it belongs: in your database.
This article explains the different strategies for combining your data with xServer functions. They depend primarily on the quantity of the data and the complexity of the use case.
Making your Data spatial-aware
First you have to make your business data “spatial aware”. You can do this just by adding two additional fields: latitude and longitude. If you need coordinates for your address data, you can use PTV xLocate to perform a geocoding, which calulates the lat/lon values for an address. Read here for guidelines how to use xLocate in various programming languages.
After you’ve stored these fields in your data table, it should be prepared for most geographic use cases. The database doesn’t necessarily need do be a fully-fledged Oracle-DB, it can also be a plain old csv-file. This can be loaded into the application or browser and displayed on a map. Here’s a sample for 10k locations loaded as .csv from here and displayed on via Leaflet.
Search and Analze your Data
Geocoding your data not only enables to display it on a map, you can also search for all locations which are reachable within a certain time (by car, pedestrian, etc.). You can find the source code here.
Working with Regions
Most modern map clients also support the display of region data (postal code regions or districts) as GeoJSON. This data can be obtained by our partner dds, either combined with socio-economic data, or just as borders which can be linked to your own business data (for example by postal-code). This sample displays the regions and municipalities of Luxembourg. The source code can be found here.
Large and Complex Data
One limitation of client-side rendering is that both the bandwidth and client-performance is usually limited. This requires a more complex setup, where the client only displays pre-rendered images from an application service.
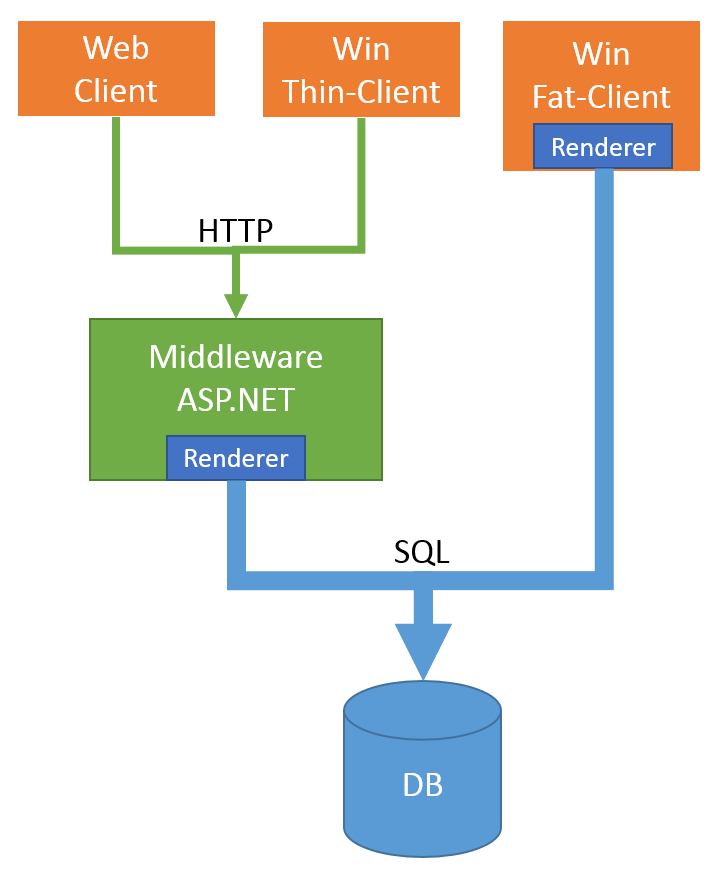
This sample uses this approach. The client can be Leaflet or PTV xServer.NET, while the rendering is performed in ASP.NET utilizing SharpMap. The source code can be found here.
Just as for client-side data, the data can be linked to application data and combined with xServer for analytic queries.
xMapServer for Visualizations
xMapServer2 also plays well with the ultra modern WebGL-based clients:
xMapServer2 together with socio-economic using Cesium
xMapServer2 plus 3d-heatmap usinusig deck.gl
References
- xServer-dashboard - PTV xServer documentation
- xServer.js - JavaScript Samples for PTV xServer
- xServer.NET - Source code for PTV xServer.NET
- SharpMap.Widgets - Build responsive map applications for web and desktop
- SharpMap.Ptv - SharpMap Addons for PTV Services and Data
- SpatialTutorial - A tutorial that shows some practices to visualize, analyze and manipulate spatial data with PTV xServer, ASP.NET and JavaScript