Building your Stacked Line Chart
This example uses d3, miso.dataset & rickshaw to build a stacked graph.
Dependencies
- Miso dataset: http://cloud.github.com/downloads/misoproject/dataset/miso.ds.deps.min.0.4.0.js
- d3: http://d3js.org/d3.v3.min.js
- Rickshaw: http://code.shutterstock.com/rickshaw/rickshaw.min.js
Data:
The google spreadsheet utilized in the example is here:
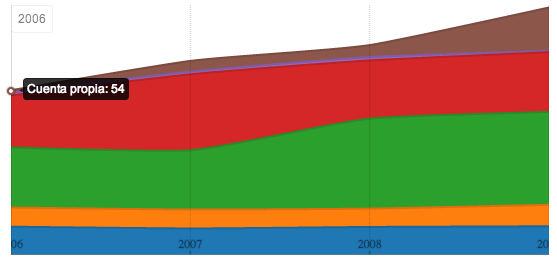
The data demonstrates types of industries and the number of sick permits they were issued per year, from 2006-2009.
Running Example:
The code is running in this jsFiddle.