This example shows Matteo Niccoli’s linear L* color scale, an implementation of a palette originally found in Kindlmann et al. 2002, as well as its decomposition in the HCL color space (aka CIELCH). This perceptually-based color scale features a linear increase in lightness (depicted in the grayscale version below the scale), while also changing hue.
I am not sure about the reason but, at least in my implementation and with my screen, a weird band is clearly visible near the middle of the green band, both in color and in grayscale.
This scale can be used to perform a color encoding of a linear variable, for example when displaying a heat map. Classic choices for such a case are rainbow scales (which have the problem of artefacts, making the encoding excessively non-linear) or grayscales (which are fine, but lack color information, which can be useful to perceive small changes or better identify areas with a similar value).
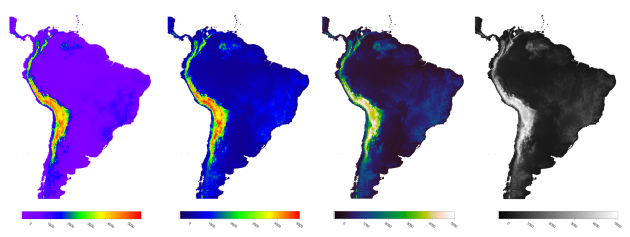
This comparison (taken from this Matteo Niccoli’s post) shows the use of ROYGBIV, rainbow, linear L* and gray color scales to map elevation data.
All palette data is available as CSV and other formats from this link.